VACCINATIONS
Vaccinated% min 1-Dose
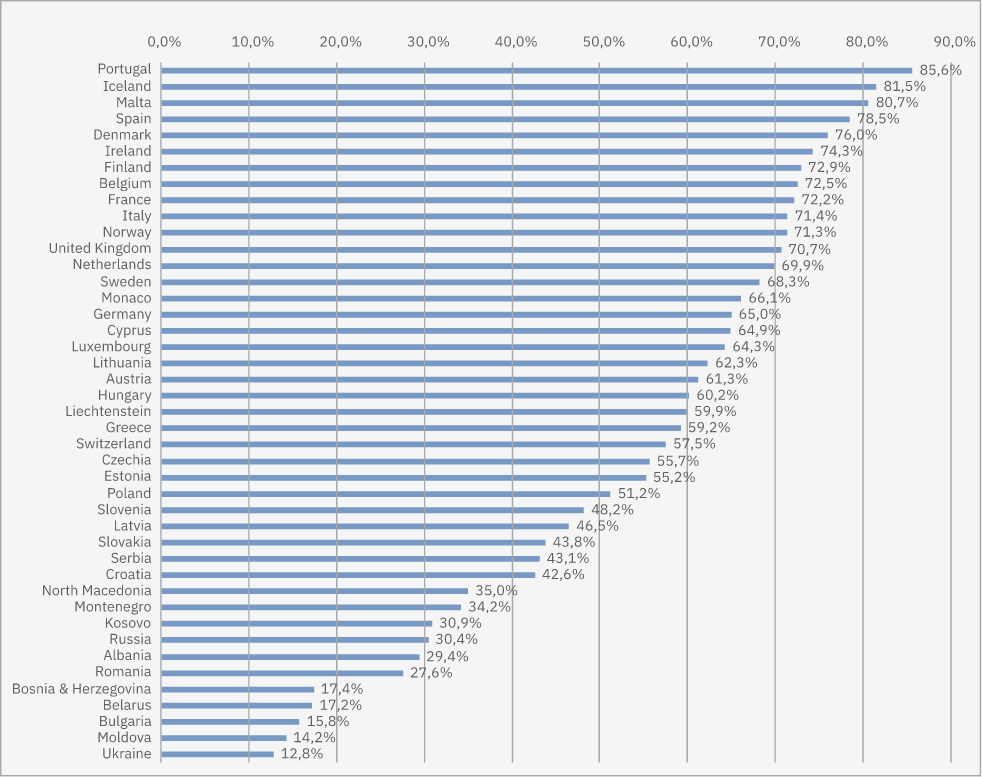
Τhe above graph demonstrates the population percentage vaccinated with at least one dose for all the European countries. Many Western European Countries have a high percentage of vaccination, above 70%. On the other hand, many Eastern European Countries have a medium to low percent of vaccination.
On the table below we can see the age distribution of vaccinations. It is remarkable that Western countries with high percent of vaccination, have also high percent of vaccination in the younger groups.
| Country | Vacinnated% min 1- dose | 80+ years | 70-79 years | 60-69 years | 50-59 years | 25-49 years | 18-24 years |
|---|---|---|---|---|---|---|---|
| Portugal | 85,6% | 100,0% | 100,0% | 100,0% | 98,8% | 93,7% | 91,1% |
| Iceland | 81,5% | 100,0% | 100,0% | 99,4% | 92,5% | 86,8% | 85,5% |
| Malta | 80,7% | 100,0% | 100,0% | 95,6% | 89,1% | 89,0% | 80,9% |
| Spain | 78,5% | 100,0% | 98,9% | 98,4% | 94,6% | 83,2% | 82,6% |
| Denmark | 76,0% | 100,0% | 100,0% | 97,2% | 94,4% | 83,7% | 79,9% |
| Ireland | 74,3% | 100,0% | 100,0% | 100,0% | 98,2% | 87,2% | 83,5% |
| Finland | 72,9% | 95,3% | 99,7% | 91,6% | 88,1% | 80,3% | 74,3% |
| Belgium | 72,5% | 91,0% | 96,1% | 93,5% | 90,0% | 81,6% | 77,5% |
| France | 72,2% | 86,4% | 97,3% | 90,0% | 90,3% | 85,0% | 87,9% |
| Italy | 71,4% | 97,6% | 92,2% | 90,4% | 86,1% | 77,6% | 83,2% |
| Norway | 71,3% | 98,4% | 100,0% | 97,4% | 95,3% | 85,7% | 86,7% |
| United Kingdom | 70,7% | ||||||
| Netherlands | 69,9% | ||||||
| Sweden | 68,3% | 95,1% | 96,4% | 91,8% | 89,5% | 78,5% | 72,0% |
| Monaco | 66,1% | ||||||
| Monaco | 65,0% | ||||||
| Cyprus | 64,9% | 97,3% | 96,8% | 89,7% | 84,1% | 77,0% | 59,3% |
| Luxembourg | 64,3% | 87,7% | 87,7% | 85,2% | 82,7% | 70,3% | 62,2% |
| Lithuania | 62,3% | 60,4% | 77,5% | 80,6% | 74,0% | 71,1% | 68,4% |
| Austria | 61,3% | 100,0% | 83,9% | 86,8% | 77,1% | 66,9% | 62,5% |
| Hungary | 60,2% | 76,2% | 86,9% | 78,7% | 72,5% | 62,4% | 50,0% |
| Liechtenstein | 59,9% | ||||||
| Greece | 59,2% | 74,0% | 82,4% | 79,9% | 73,9% | 64,1% | 55,6% |
| Switzerland | 57,5% | ||||||
| Czechia | 55,7% | 83,8% | 88,5% | 76,2% | 72,3% | 56,7% | 54,9% |
| Estonia | 55,2% | 67,1% | 77,1% | 72,7% | 70,5% | 61,9% | 63,5% |
| Poland | 51,2% | 67,6% | 86,2% | 72,8% | 64,7% | 54,0% | 48,3% |
| Slovenia | 48,2% | 77,2% | 85,8% | 75,5% | 67,6% | 50,5% | 49,9% |
| Latvia | 46,5% | 44,1% | 55,7% | 57,4% | 54,6% | 52,9% | 58,4% |
| Slovakia | 43,8% | 59,1% | 74,1% | 63,9% | 55,4% | 45,6% | 43,3% |
| Serbia | 43,1% | ||||||
| Croatia | 42,6% | 58,0% | 75,2% | 70,2% | 58,1% | 43,1% | 29,6% |
| North Macedonia | 35,0% | ||||||
| Montenegro | 34,2% | ||||||
| Kosovo | 30,9% | ||||||
| Russia | 30,4% | ||||||
| Albania | 29,4% | ||||||
| Albania | 29,4% | ||||||
| Romania | 27,6% | 20,3% | 37,5% | 39,7% | 39,1% | 32,7% | 28,9% |
| Bosnia and Herzegovina | 17,4% | ||||||
| Belarus | 17,2% | ||||||
| Bulgaria | 15,8% | 21,2% | 32,8% | 31,2% | 26,8% | 19,5% | 13,2% |
| Moldova | 14,2% | ||||||
| Ukraine | 12,8% |
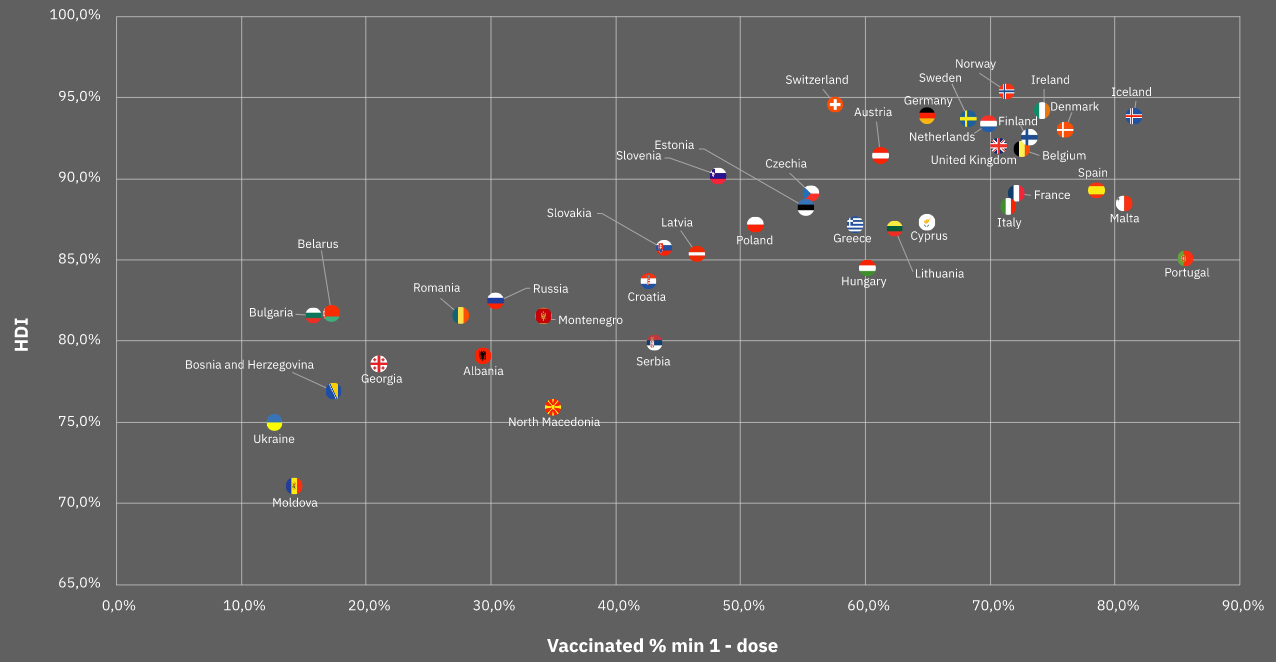
The following graph demonstrates the high positive correlation (0.85) between countries’ HDI (Human Development Index) and Vaccination percentage. We note that countries with low HDI have significantly lower percentage of vaccination, an issue which may affect negatively the long term pandemic containment.
The table below demonstrates selected pandemic KPIs in three European country groups, formed by their level of vaccination.
We can clearly see that Countries with over 70% vaccinated population are more prosperous, better educated, more healthy, more democratic, leading to overall lower negative effects from the pandemic.
| KPI's | Vaccinations >=70% | Vaccinations >= 55% -70% | Vaccinations < 55% |
|---|---|---|---|
| Mortality% Jun '21 - Aug'21 | 1,5% | 1,6% | 2,6% |
| Cases per 1M Jun '21 - Aug'21 | 14.594 | 12.331 | 3.305 |
| Deaths per 1M Jun '21 - Aug'21 | 42 | 59 | 73 |
| Prosperity Index | 78,2 | 75,9 | 68,3 |
| Health Score | 81,4 | 79,4 | 75,3 |
| % With Perceived Good Health | 71,0 | 66,6 | 60,0 |
| Life Expectancy | 82,8 | 81,2 | 78,0 |
| % Aged >=65 | 19,3 | 18,9 | 18,4 |
| Education Score | 83,1 | 81,6 | 76,1 |
| Personal Freedom | 85,2 | 77,3 | 65,1 |
| Social Capital | 64,0 | 59,7 | 48,1 |
| Religious Index | 0,37 | 0,41 | 0,57 |
| Num Of Countries | 11 | 10 | 7 |