GENERAL FINDINGS
During the first wave of the pandemic (February to April 2020), Greece demonstrated a remarkable performance, as result of the prompt governmental response. From September 2020 onwards when the second wave developed the pandemic proved to be much more severe, due to limited restrictions, accompanied by colder weather which facilitated the spread. A similar situation describes the third wave which hit the country from Ferbruary’21 until May’21, when the containenment of pandemic was achieved.
Up to the end of August, the COVID-19 pandemic concequences seemed under control with only 262 deaths recorded. September and October showed the first signs that the worst was yet to come with 358 deaths recorded. Consequently, November’s infection spread had already started to expand with a positivity rate of about 8% and 1701 deaths recorded which is 21% of the total deaths to date. The attempt to contain the pandemic is reflected by the increasing number of tests performed, reaching 71k Τests per 1M population in November.
The substantial increase in Tests performed from November’20 onwards, combined with the quarantine measures imposed, reduced the spread of the pandemic during the next couple of months. From February’21 onwards an intense third wave hit once more the country. During this third wave, despite the high number of Tests (over – 100.000 in 1M), the fatigue of the population prevented the discipline to the quarantine measures, resulting in similar morbidity as the one of the second wave.
Within summer of ‘21, touristic mobility and testing policy resulted in high numbers of cases, but in reduced number of deaths proportionally due to the effect of vaccinations.
| Month | Total Cases | % Cases by Month | Total Deaths | % Deaths by Month | % Mortality by Month | % Mortality (Rolling) | Cases per 1M | Deaths per 1M | Tests per 1M | % Positivity |
|---|---|---|---|---|---|---|---|---|---|---|
| Feb‘20 | 4 | 0,0% | 0 | 0,0% | 0,0% | |||||
| Mar‘20 | 1.208 | 0,3% | 43 | 0,4% | 3,6% | 3,5% | 113 | 4 | 1605 | 7,0% |
| Apr‘20 | 1.364 | 0,3% | 96 | 0,8% | 7,0% | 5,4% | 127 | 9 | 5.607 | 2,3% |
| May‘20 | 339 | 0,1% | 36 | 0,3% | 10,6% | 6,0% | 32 | 3 | 10.107 | 0,3% |
| Jun‘20 | 475 | 0,1% | 16 | 0,1% | 3,4% | 5,6% | 44 | 1 | 12.689 | 0,3% |
| Jul‘20 | 1.011 | 0,3% | 12 | 0,1% | 1,2% | 4,6% | 94 | 1 | 19.871 | 0,5% |
| Aug‘20 | 5.733 | 1,4% | 59 | 0,5% | 1,0% | 2,6% | 535 | 6 | 41.204 | 1,3% |
| Sep‘20 | 7.989 | 2,0% | 126 | 1,0% | 1,6% | 2,1% | 745 | 12 | 35.468 | 2,1% |
| Oct‘20 | 19.073 | 4,7% | 232 | 1,9% | 1,2% | 1,7% | 1.778 | 22 | 50.837 | 3,5% |
| Nov‘20 | 67.031 | 16,7% | 1.701 | 14,1% | 2,5% | 2,2% | 6.250 | 159 | 70.789 | 8,8% |
| Dec‘20 | 33.691 | 8,4% | 2.467 | 20,5% | 7,3% | 3,5% | 3.141 | 230 | 76.343 | 4,1% |
| Jan‘21 | 18.107 | 4,5% | 958 | 8,0% | 5,3% | 3,7% | 1.688 | 89 | 76.640 | 2,2% |
| Feb‘21 | 34.143 | 8,5% | 708 | 5,9% | 2,1% | 3,4% | 3.184 | 66 | 101.175 | 3,1% |
| Mar‘21 | 70.246 | 17,5% | 1.549 | 12,9% | 2,2% | 3,1% | 6.550 | 144 | 124.712 | 5,3% |
| Apr‘21 | 82.831 | 20,6% | 2.298 | 19,1% | 2,8% | 3,0% | 7.723 | 214 | 148.128 | 5,2% |
| May‘21 | 58.393 | 14,5% | 1.739 | 14,4% | 3,0% | 3,0% | 5.445 | 162 | 138.239 | 3,9% |
| Jun‘21 | 20.528 | 3,5% | 622 | 4,6% | 3,0% | 3,0% | 1.914 | 58 | 90.768 | 2,1% |
| Jul‘21 | 68.723 | 11,8% | 247 | 1,8% | 0,4% | 2,6% | 6.408 | 23 | 191.701 | 3,3% |
| Aug‘21 | 93.106 | 15,9% | 677 | 5,0% | 0,7% | 2,3% | 8.682 | 63 | 241.010 | 3,6% |
| Total | 583.995 | 13.586 | 2,3% | 54.454 | 1267 | 1.436.893 | 3,8% |
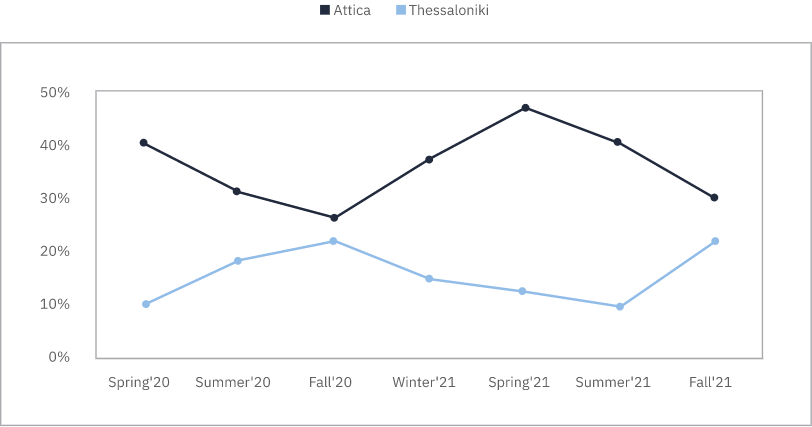
The distribution of COVID-19 cases among the two most populated areas in the country is depicted below, showing that after the summer period Thessaloniki’s transmission grows, while we notice a lower transmission in the Capital’s area. In Spring, the opposite pattern was noticed with Attica having half of the cases in the country.
% Cases per Region
The evolution of the infection severity is best demonstrated in the graphs that follow below:
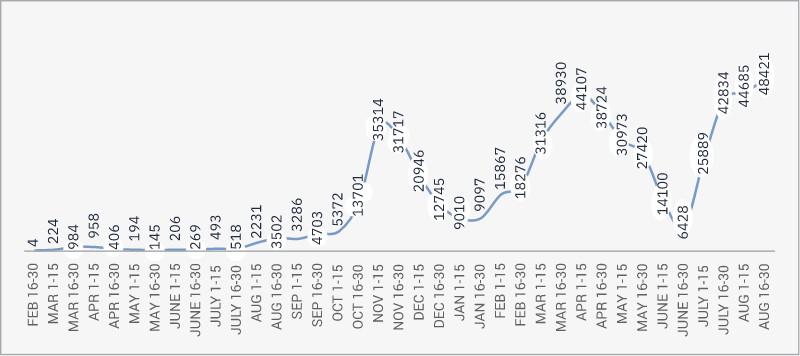
Cases per 15 Days
Deaths per 15 Days
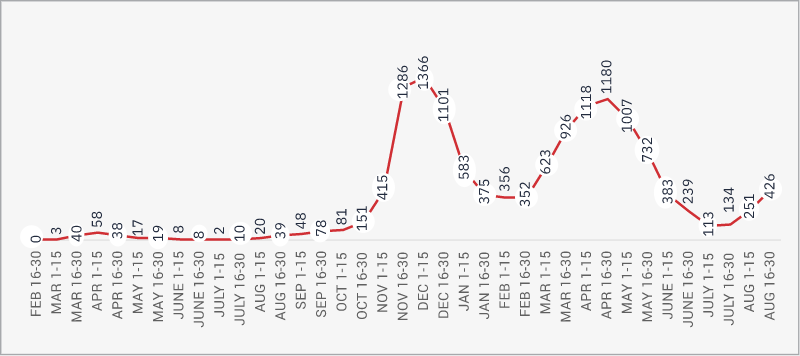
In the second wave cases reach their peak with ~35000 infections in the middle of November, while deaths reached their peak with 1366 deaths within the first two weeks of December. While in the third wave, from March’21 to May’21, cases reached a peak of 44.000, but deaths reached a marginal lower peak of 1180 during the last two weeks of April. The lower death peak of the third wave is probably explained by the vaccination policy which started in January’21 with the older part of the population.
Greece during the second and third wave of the pandemic falls among the top 20 countries globally with respect to number of Deaths per 1M population.
Ranking of Greece - Death per Million by Week
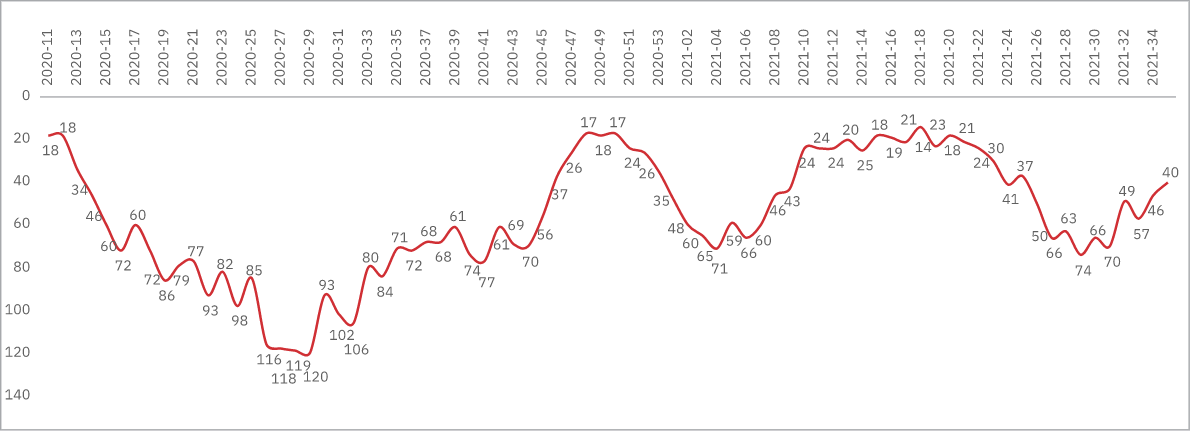
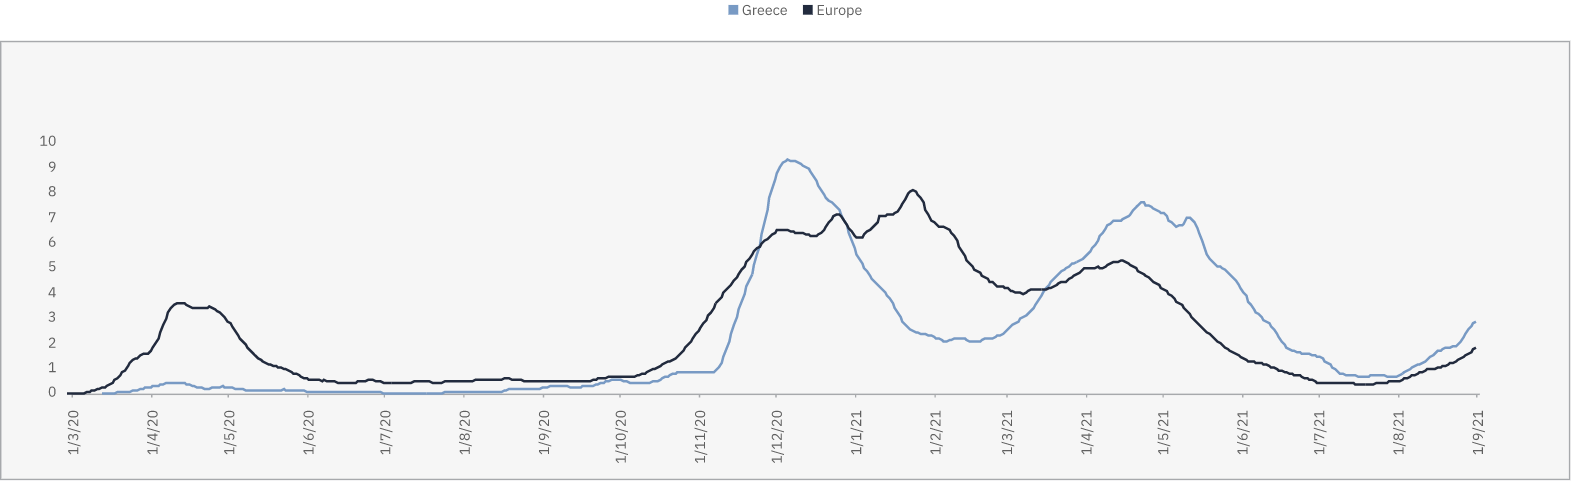
Comparing Deaths per 1M population between Greece and the rest of Europe, all along the pandemic evolution, we note that Greece presents worse numbers than the rest of Europe during the second and third wave.
Daily Deaths per 1M MA7 - Greece vs Europe
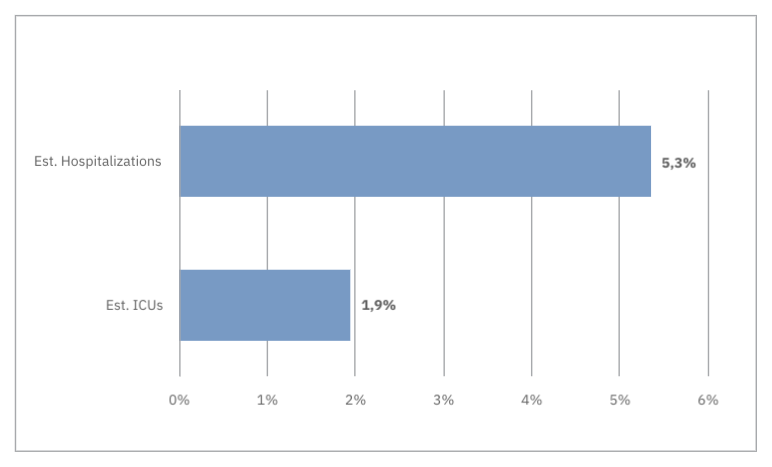
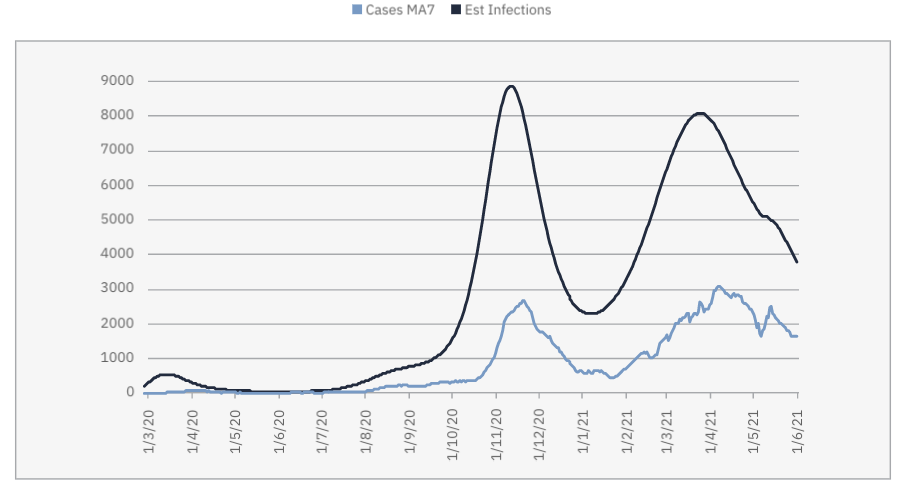
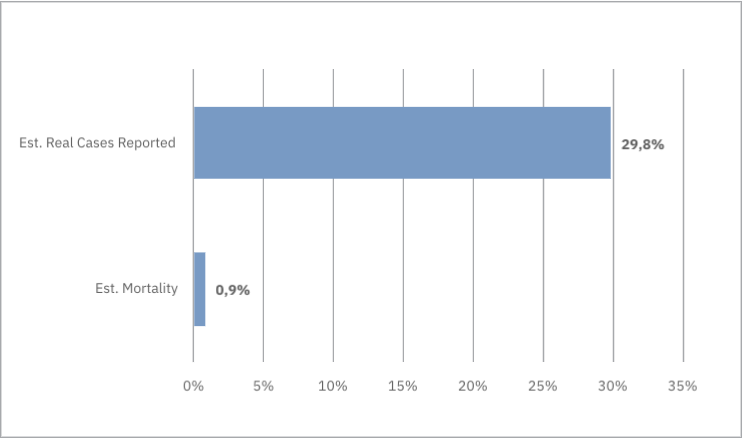
Based on models’ estimations the cases reported are about 30% of the total infections considering both asymptomatic and pre-symptomatic cases. As a result of that the actual mortality (IFR) is about 0.9% (3 times lower than mortality calculated on diagnosed cases). Consequently, hospital and ICU admissions on the estimated cases, is about 5% and 2% respectively. The following three graphs are not updated, as the increased number of daily tests and the vaccination effect prevent a valid comparison.
Reported vs Estimated Cases
Estimated Real Cases & Mortality
Hospitalizations & ICU incidents