2ND & 3RD WAVE OF THE PANDEMIC
Deaths per 1M
We can easily see in the above graph that during the first wave of the pandemic Western Europe and Sweden where the main areas to suffer mostly. On the other hand, Central Europe and Balkan countries are the main areas contributing to the pandemic losses during the second and third wave. Having said that, most European countries suffered substantial losses during the second and third wave, with the exception of the Scandinavian countries, excluding Sweden.
Some additional statistical data presented in the table below, will help us explain why the Balkan countries appear to have some of the highest Deaths per Million from COVID-19, while the Scandinavian countries appear to have some of the lowest Deaths per Million.
Social & Health by Regions
| Sub - Regions | Regions | Average household size | 1 member | 2-3 members | 4-5 members | 6 or more members | Aged 65 years or over |
|---|---|---|---|---|---|---|---|
| Western Europe | Western Europe | 2,4 | 30,3% | 47,8% | 19,7% | 2,2% | |
| Ex East Block (Central Europe) | Eastern Europe | 2,6 | 28,5% | 45,8% | 21,6% | 4,2% | |
| Balkans | Eastern Europe | 2,9 | 23,4% | 45,2% | 25,5% | 6,0% | 38,8% |
| Greece | Western Europe | 2,6 | 25,7% | 49,2% | 22,6% | 2,5% | 36,8% |
| Baltic | Eastern Europe | 2,4 | 31,5% | 48,3% | 17,9% | 2,3% | 37,4% |
| Scandinavian | Western Europe | 2,1 | 40,3% | 42,6% | 15,5% | 1,6% |
| Sub - Regions | Regions | GDP per Capita | Informal Employment | Living Conditions Index 2019 | Health Index 2019 | Care Home Beds per 1000 | Diabetes Prevalence | Cardiovascular Disease deaths % | Obesity Rate % |
|---|---|---|---|---|---|---|---|---|---|
| Western Europe | Western Europe | 51.875 | 94,3 | 81,7 | 7,7 | 6,2% | 33,7% | 22,8% | |
| Ex East Block (Central Europe) | Eastern Europe | 18.509 | 89,4 | 77,5 | 6,0 | 6,9% | 46,0% | 23,9% | |
| Balkans | Eastern Europe | 9.898 | 27,4% | 83,0 | 73,3 | 2,0 | 8,5% | 52,9% | 21,8% |
| Greece | Western Europe | 20.330 | 87,7 | 79,1 | 0,2 | 4,6% | 43,0% | 24,9% | |
| Baltic | Eastern Europe | 13.905 | 85,8 | 71,0 | 4,2 | 5,0% | 56,8% | 23,3% | |
| Scandinavian | Western Europe | 61.814 | 96,3 | 82 | 9,8 | 5,6% | 34,9% | 21,4% |
Some of factors that can explain the high death per million scores of the Eastern European countries are the following:
- - The high average household size e.g Balkans (2,9), which may lead to domestic spread of the virus. 30% of households has 4+ members.
- - The significantly lower GDP combined with a high Informal Employment percentage, factors that may indicate that people in these countries cannot respect the government lockdown rules, as they need to go out to seek a job, let alone that they cannot benefit of the state financial help, as the government has no way to identify them.
- - Finally, the poor quality of the health system in Eastern European countries combined with health problems, could also be responsible for the significantly higher deaths per million in this region. Scandinavian countries, where Deaths per Million are much lower, can attribute this success to the low density of the population as well as the small household size (40% of the household are single households). Also, even though they have the highest number of elderly care home facilities, they seem to have protected them much more successfully, with the exception of Sweden, who had a very different approach during the first wave of the pandemic. It worth noting that Hungary and the Chech Republic demonstrated some to the worse Deaths rates per 1M, during the second and third wave as their preventive policies were almost non-existing due to internal political conflicts characterized by irrational propaganda.
Scandinavian countries, where deaths per million are much lower, can attribute this success to the low density of the population as well as the small household size (40% of the household are single households). Also, even though they have the highest number of elderly care home facilities, they seem to have protected them much more successfully, with the exception of Sweden, who had a very different approach during the first wave of the pandemic.
It worth noting that Hungary and the Chech Republic demonstrated some to the worse Deaths rates per 1M, during the second and third wave as their preventive policies were almost non-existing due to internal political conflicts characterized by irrational propaganda.
Average Mobility - Nov ’20-May ’21
Another reason for the aggressive second and third waves from October onwards, is the significantly lower mobility reduction rates compared to first wave. The maximum reduction of mobility in the second and third wave is that of Ireland and the UK (52% and 51%), while in the first wave many countries had reached 70%. This is probably the result of less strict measures during second and third waves, without general lockdown measures, as well as the lower population response to the restrictive measures, due to general fatigue.
Mobility vs Death per 1M November
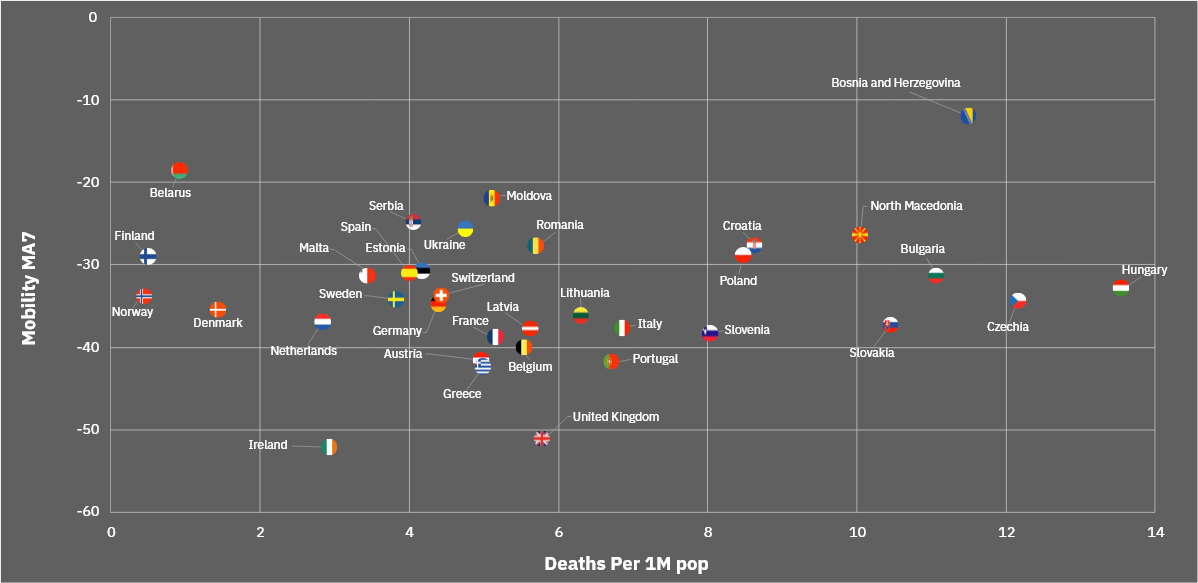
The above graph presenting the relation between Death per 1M and Mobility, demonstrates a positive correlation that is: the higher the deaths per 1M Pop, the higher the mobility reduction. As strict measures such as lockdowns usually follow the pandemic rage. There is again a group of Central European and Balkan Countries which do not follow their trend, most probably for reason already discussed at the beginning of the section.