General Findings
COVID-19 PANDEMIC has hit Europe much more than other geographical regions of the world, having almost 26% of diagnosed cases and deaths. We can also see that there is a significant difference between Western and Eastern Europe, with Western Europe having almost 16% of cases and deaths.
| Area | Total Cases | Cases % | Total Deaths | Deaths % | Mortality % | Cases per 1M | Deaths per 1M |
|---|---|---|---|---|---|---|---|
| Western Europe | 35.520.986 | 16,4% | 665.342 | 15,2% | 1,9% | 83.428 | 1.563 |
| Eastern Europe | 21.189.497 | 9,8% | 511.259 | 11,7% | 2,4% | 62.241 | 1.502 |
| Total Europe | 56.710.483 | 26,2% | 1.176.601 | 26,9% | 2,1% | 74.014 | 1.535 |
| North America | 40.280.930 | 18,6% | 655.588 | 15,0% | 1,6% | 109.897 | 1.789 |
| Latin America and the Caribbean | 43.458.129 | 20,1% | 1.327.011 | 30,3% | 3,1% | 67.162 | 2.051 |
| Asia-Pacific | 50.343.781 | 23,3% | 783.277 | 17,9% | 1,6% | 11.860 | 185 |
| Middle East and North Africa | 20.012.229 | 9,3% | 297.968 | 6,8% | 1,5% | 37.267 | 555 |
| Sub-Saharan Africa | 5.423.114 | 2,5% | 132.940 | 3,0% | 2,5% | 4.882 | 120 |
| Global | 216.228.666 | 4.373.385 | 2,0% | 28.182 | 570 |
Europe - Deaths per 1M MA7
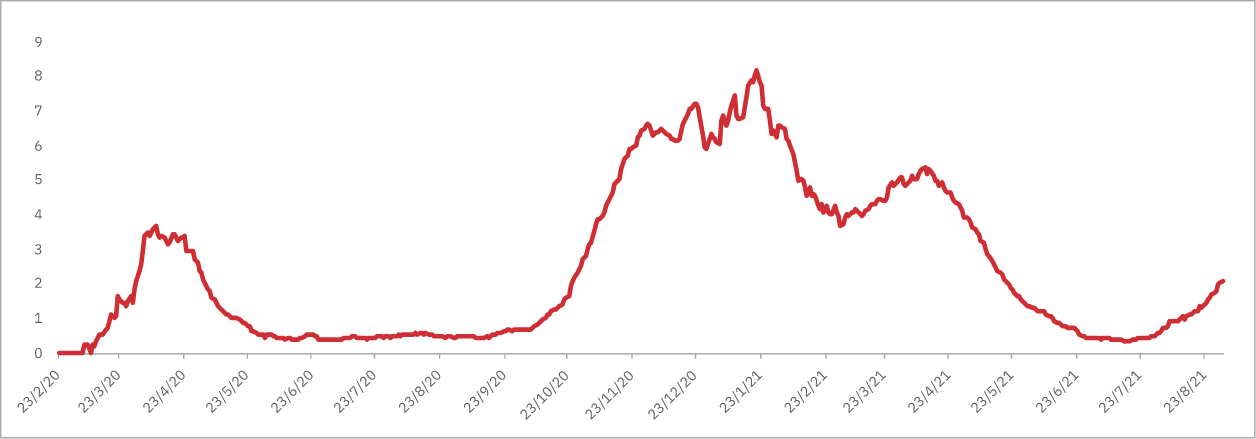
The first wave of the pandemic (Feb-May 2020) was quite difficult, with a stable and controllable summer period, followed by a much more aggressive second wave, especially from October 2020 onwards. The second wave reached its peak during January 2021, when a decline started, but before reaching the highest level of the first wave towards the end of February, a third wave started to develop, somehow milder than the second one. It is interesting to examine the differentiation by region of the general pandemic trend. The graph below, of Deaths per Million of Population, demonstrates the outlined differences.
Deaths per 1M
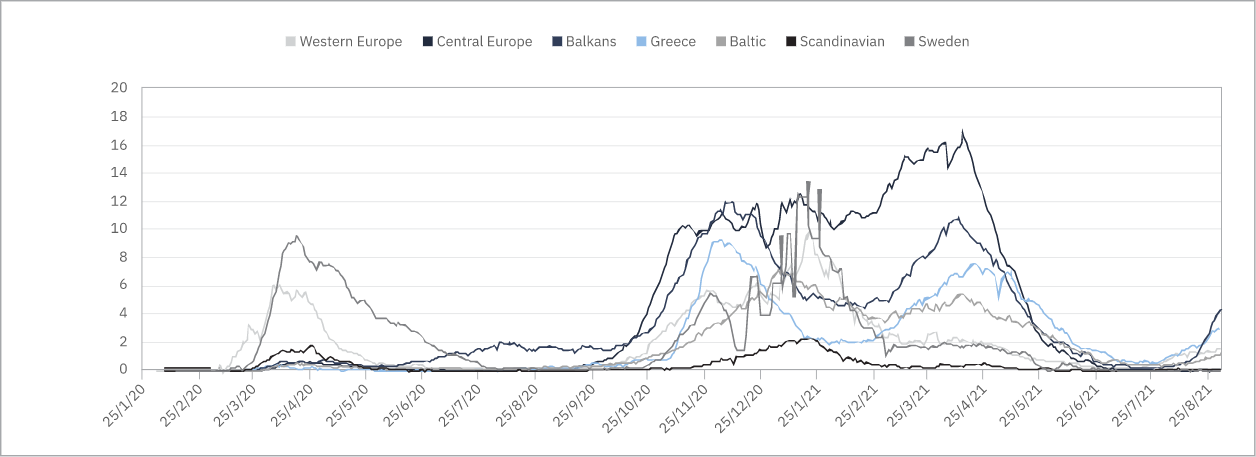
Western European countries, together with Sweden, faced a much more severe first wave, compared to other European regions. While in the second wave, ex-Eastern block countries of Central Europe, the Balkans and Greece together with the Western European countries, were hit badly by the pandemic. On the other hand, the Baltic and the rest of Scandinavian countries had a much milder hit during both waves. Finally, the Central European countries and the Balkans contributed mostly during the third wave.
Phases by Regions
| Europe - Regions | # Countries | Total Cases per 1M | Total Deaths per 1M | % Mortality |
|---|---|---|---|---|
| Western Europe | 17 | 88.726 | 1.679 | 1,9% |
| Ex East Block (Central Europe) | 4 | 89.905 | 2.310 | 2,6% |
| Balkans | 11 | 73.817 | 1.803 | 2,4% |
| Greece | 1 | 54.454 | 1.267 | 2,3% |
| Baltic | 5 | 56.573 | 1.116 | 2,0% |
| Scandinavian | 3 | 37.745 | 261 | 0,7% |
| Sweden | 1 | 109.403 | 1.407 | 1,3% |
| Europe - Regions | Cases per 1M(Feb'20 - May'20) | Cases per 1M(Jun'20 - Aug'20) | Cases per 1M(Sep'20 - Nov'20) | Cases per 1M(Dec'20 - Feb'21) | Cases per 1M(Mar'21 - May'21) | Cases per 1M (Jun‘21 - Aug‘21) |
|---|---|---|---|---|---|---|
| Western Europe | 3.261 | 1.617 | 21.616 | 26.093 | 17.818 | 15.998 |
| Ex East Block (Central Europe) | 598 | 985 | 27.043 | 28.462 | 32.088 | 730 |
| Balkans | 959 | 3.563 | 20.418 | 22.924 | 21.501 | 4.452 |
| Greece | 272 | 673 | 8.774 | 8.013 | 19.718 | 17.004 |
| Baltic | 1.168 | 2.151 | 12.619 | 17.677 | 19.312 | 3.647 |
| Scandinavian | 1.614 | 507 | 6.210 | 11.845 | 9.639 | 7.930 |
| Sweden | 3.753 | 4.481 | 15.532 | 39.075 | 39.753 | 5.398 |
| Europe - Regions | Deaths per 1M(Feb'20 - May'20) | Deaths per 1M(Jun'20 - Aug'20) | Deaths per 1M(Sep'20 - Nov'20) | Deaths per 1M(Dec'20 - Feb'21) | Deaths per 1M(Mar'21 - May'21) | Cases per 1M (Jun‘21 - Aug‘21) |
|---|---|---|---|---|---|---|
| Western Europe | 398 | 32 | 255 | 655 | 232 | 65 |
| Ex East Block (Central Europe) | 30 | 18 | 434 | 859 | 939 | 36 |
| Balkans | 46 | 107 | 366 | 585 | 617 | 83 |
| Greece | 16 | 8 | 192 | 385 | 521 | 144 |
| Baltic | 18 | 39 | 181 | 329 | 468 | 80 |
| Scandinavian | 67 | 6 | 20 | 128 | 32 | 9 |
| Sweden | 452 | 114 | 86 | 556 | 140 | 13 |
| Europe - Regions | % Mortality(Feb'20 - May'20) | % Mortality(Jun'20 - Aug'20) | % Mortality(Sep'20 - Nov'20) | % Mortality(Dec'20 - Feb'21) | % Mortality(Mar'21 - May'21) | % Mortality (Jun‘21 - Aug‘21) |
|---|---|---|---|---|---|---|
| Western Europe | 12,2% | 2,0% | 1,2% | 2,5% | 1,3% | 0,4% |
| Ex East Block (Central Europe) | 5,1% | 1,9% | 1,6% | 3,0% | 2,9% | 4,9% |
| Balkans | 4,8% | 3,0% | 1,8% | 2,6% | 2,9% | 1,9% |
| Greece | 6,0% | 1,2% | 2,2% | 4,8% | 2,6% | 0,8% |
| Baltic | 1,6% | 1,8% | 1,4% | 1,9% | 2,4% | 2,2% |
| Scandinavian | 4,2% | 1,2% | 0,3% | 1,1% | 0,3% | 0,1% |
| Sweden | 12,1% | 2,6% | 0,6% | 1,4% | 0,4% | 0,2% |
Ranking - Cases & Deaths per 1M (Feb-May 2021)
| A/A | Country | Cases 1M |
|---|---|---|
| 1 | Montenegro | 182.996 |
| 2 | Czechia | 156.194 |
| 3 | Cyprus | 130.005 |
| 4 | Slovenia | 127.158 |
| 5 | Luxembourg | 123.707 |
| 6 | Netherlands | 112.204 |
| 7 | Sweden | 109.403 |
| 8 | Serbia | 109.112 |
| 9 | Estonia | 106.597 |
| 10 | Lithuania | 106.295 |
| 11 | Spain | 103.708 |
| 12 | France | 103.390 |
| 13 | Belgium | 102.724 |
| 14 | United Kingdom | 100.705 |
| 15 | Portugal | 100.141 |
| 16 | Monaco | 95.814 |
| 17 | Croatia | 91.164 |
| 18 | Switzerland | 90.153 |
| 19 | Liechtenstein | 85.283 |
| 20 | North Macedonia | 84.440 |
| 21 | Hungary | 83.174 |
| 22 | Kosovo | 79.554 |
| 23 | Austria | 77.150 |
| 24 | Poland | 75.717 |
| 25 | Italy | 75.025 |
| 26 | Latvia | 73.518 |
| 27 | Malta | 73.363 |
| 28 | Slovakia | 71.299 |
| 29 | Ireland | 71.273 |
| 30 | Moldova | 65.992 |
| 31 | Bulgaria | 64.710 |
| 32 | Bosnia and Herzegovina | 64.425 |
| 33 | Denmark | 59.286 |
| 34 | Romania | 56.518 |
| 35 | Greece | 54.454 |
| 36 | Ukraine | 52.418 |
| 37 | Albania | 50.899 |
| 38 | Belarus | 50.758 |
| 39 | Germany | 47.190 |
| 40 | Russia | 47.084 |
| 41 | Iceland | 30.222 |
| 42 | Norway | 29.383 |
| 43 | Finland | 23.153 |
| A/A | Country | Deaths 1M |
|---|---|---|
| 1 | Hungary | 3.073 |
| 2 | Bosnia and Herzegovina | 2.967 |
| 3 | North Macedonia | 2.839 |
| 4 | Czechia | 2.833 |
| 5 | Montenegro | 2.544 |
| 6 | Bulgaria | 2.686 |
| 7 | Slovakia | 2.289 |
| 8 | Belgium | 2.193 |
| 9 | Italy | 2.134 |
| 10 | Croatia | 2.030 |
| 11 | United Kingdom | 1.978 |
| 12 | Poland | 1.970 |
| 13 | Slovenia | 1.837 |
| 14 | Portugal | 1.722 |
| 15 | France | 1.686 |
| 16 | Spain | 1.683 |
| 17 | Romania | 1.590 |
| 18 | Moldova | 1.582 |
| 19 | Lithuania | 1.502 |
| 20 | Liechtenstein | 1.433 |
| 21 | Sweden | 1.407 |
| 22 | Kosovo | 1.372 |
| 23 | Luxembourg | 1.359 |
| 24 | Latvia | 1.340 |
| 25 | Greece | 1.267 |
| 26 | Russia | 1.246 |
| 27 | Ukraine | 1.240 |
| 28 | Austria | 1.186 |
| 29 | Switzerland | 1.185 |
| 30 | Germany | 1.104 |
| 31 | Serbia | 1.040 |
| 32 | Netherlands | 1.038 |
| 33 | Ireland | 1.037 |
| 34 | Monaco | 1.028 |
| 35 | Estonia | 973 |
| 36 | Malta | 883 |
| 37 | Albania | 877 |
| 38 | Cyprus | 572 |
| 39 | Denmark | 438 |
| 40 | Belarus | 399 |
| 41 | Finland | 181 |
| 42 | Norway | 153 |
| 42 | Iceland | 92 |
GDP per Capita vs COVID-19 Test Policy
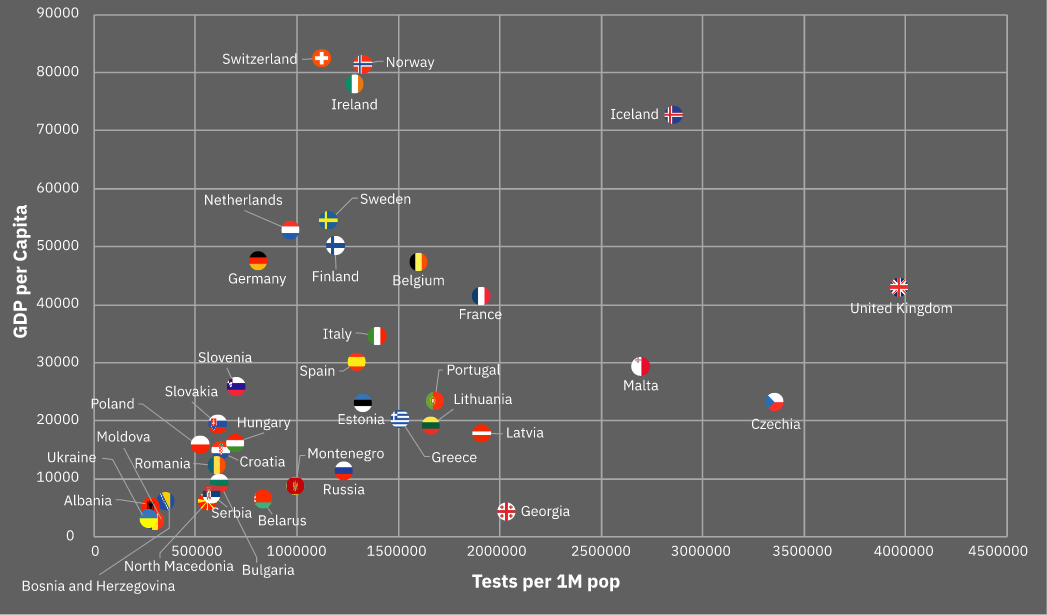
The above graph demonstrates a positive correlation between GDP and COVID-19 testing policy. There are though some exceptions to this rule, with Malta, Chechia and the United Kingdom performing significantly higher number of tests given their GDP, while Switzerland, Norway and Ireland did exactly the opposite.
GDP per Capita vs Deaths per 1M
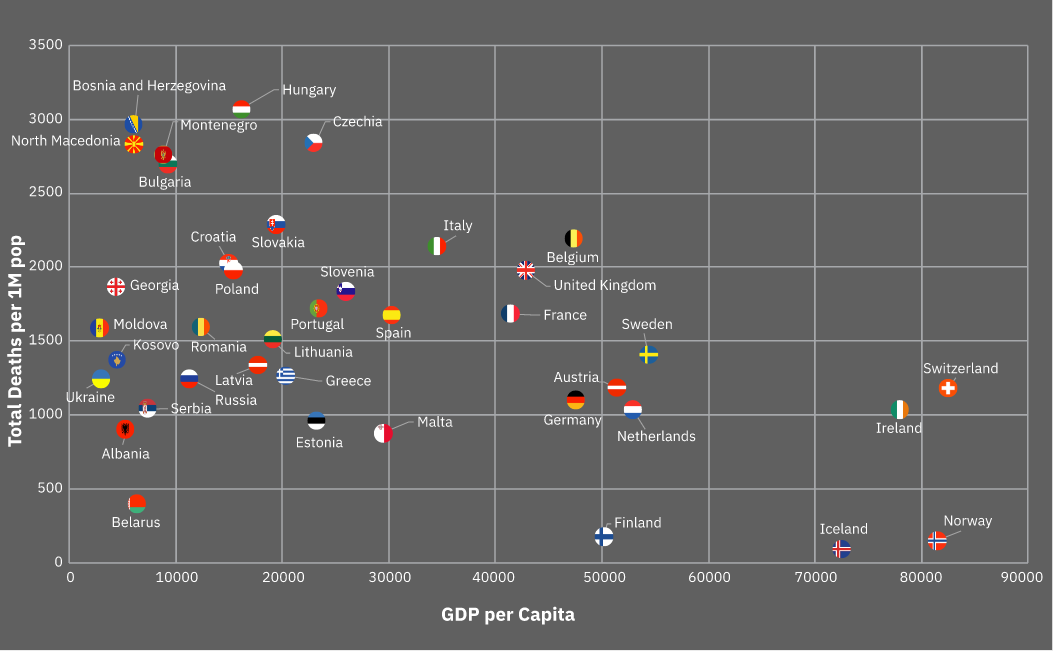
With respect to GDP per Capita, we note that there is a group of countries who perform well as far as Deaths per Million is concerned independent of the level of GDP per Capita. (Some Balkan countries, some ex-eastern block countries, Greece, Cyprus, Germany, Austria, Finland, Switzerland, Ireland, Iceland and Norway). While there is another group of countries of low and medium GDP per Capita who demonstrate much higher Death per Million index with outstanding the central European countries and some Balkan countries (Hungary, Poland,Chechia, Bulgaria, North Macedonia etc). It looks like the GDP per Capita is not a primary factor in the evolution of the pandemic in Europe. There is a negative Correlation between GDP and Deaths per 1M. (Pearson = -0.4)