GENERAL FINDINGS
Latin America is a worldwide region badly affected from COVID – 19 Pandemic. 20% of the total cases and almost 30% of the total deaths happened in Latin America.
| Area | Total Cases | Cases % | Total Deaths | Deaths % | Mortality % | Cases per 1M | Deaths per 1M |
|---|---|---|---|---|---|---|---|
| Western Europe | 35.520.986 | 16,4% | 665.342 | 15,2% | 1,9% | 83.428 | 1.563 |
| Eastern Europe | 21.189.497 | 9,8% | 511.259 | 11,7% | 2,4% | 62.241 | 1.502 |
| North America | 40.280.930 | 18,6% | 655.588 | 15,0% | 1,6% | 109.897 | 1.789 |
| Latin America and the Caribbean | 43.458.129 | 20,1% | 1.327.011 | 30,3% | 3,1% | 67.162 | 2.051 |
| Asia-Pacific | 50.343.781 | 23,3% | 783.277 | 17,9% | 1,6% | 11.860 | 185 |
| Middle East and North Africa | 20.012.229 | 9,3% | 297.968 | 6,8% | 1,5% | 37.267 | 555 |
| Sub-Saharan Africa | 5.423.114 | 2,5% | 132.940 | 3,0% | 2,5% | 4.882 | 120 |
| Global | 216.228.666 | 4.373.385 | 2,0% | 22.078 | 459 |
Eleven Latin American countries are among the Top 30 in Deaths per Million Population.
| Top 30 countries | Death per 1M |
|---|---|
| Hungary | 3.073 |
| Bosnia & Herzegovina | 2.967 |
| North Macedonia | 2.839 |
| Czechia | 2.833 |
| Montenegro | 2.758 |
| Brazil | 2.750 |
| Bulgaria | 2.686 |
| Peru | 2.589 |
| Argentina | 2.486 |
| Colombia | 2.082 |
| Slovakia | 2.289 |
| Paraguay | 2.233 |
| Belgium | 2.193 |
| Italy | 2.134 |
| Croatia | 2.030 |
| Mexico | 2.026 |
| Tunisia | 2.003 |
| United Kingdom | 1.978 |
| Poland | 1.970 |
| Chile | 1.948 |
| U.S.A | 1.911 |
| Ecuador | 1.861 |
| Slovenia | 1.837 |
| Uruguay | 1.742 |
| Portugal | 1.722 |
| France | 1.686 |
| Spain | 1.683 |
| Panama | 1.654 |
| Bolivia | 1.601 |
| Romania | 1.590 |
The table below presents the data concerning the first COVID-19 case for every country in Latin America, the date each country reached 100 diagnosed cases, the date the lockdown policies were imposed and the days elapsed from 100 cases to lockdown.
As the pandemic arrived later in Latin America in comparison with other regions of the world and lockdown measures were imposed promptly in most countries, they did not experience an aggressive first wave at the beginning. Actually, up to the middle of May 2020, the Latin America countries suffered mildly from COVID -19.
| Country | Date of 1st Case | Date of 100th Case | Date of Lockdown | Date to Lockdown from 100th Case |
|---|---|---|---|---|
| Argentina | 4/3/2020 | 20/3/2020 | 19/3/2020 | -1 |
| Bolivia | 12/3/2020 | 31/3/2020 | 16/3/2020 | -15 |
| Brazil | 26/2/2020 | 15/3/2020 | 8/4/2020 | 24 |
| Chile | 4/3/2020 | 17/3/2020 | 26/3/2020 | 9 |
| Colombia | 7/3/2020 | 19/3/2020 | 16/3/2020 | -3 |
| Costa Rica | 7/3/2020 | 21/3/2020 | 16/6/2020 | 87 |
| Cuba | 12/3/2020 | 29/3/2020 | 12/4/2020 | 14 |
| Dominican Republic | 2/3/2020 | 22/3/2020 | No Lockdown | |
| Ecuador | 1/3/2020 | 18/3/2020 | 2/3/2020 | -16 |
| El Salvador | 19/3/2020 | 9/4/2020 | 11/3/2020 | -29 |
| Guatemala | 15/3/2020 | 10/4/2020 | 22/5/2020 | 42 |
| Haiti | 20/3/2020 | 5/5/2020 | 20/3/2020 | -46 |
| Honduras | 12/3/2020 | 29/3/2020 | 6/4/2020 | 8 |
| Mexico | 14/1/2020 | 14/3/2020 | 30/3/2020 | 16 |
| El Salvador | 19/3/2020 | 9/4/2020 | 11/3/2020 | -29 |
| Nicaragua | 19/3/2020 | 23/5/2020 | No Lockdown | |
| Panama | 10/3/2020 | 19/3/2020 | 11/4/2020 | 23 |
| Paraguay | 8/3/2020 | 5/4/2020 | 20/3/2020 | -16 |
| Peru | 7/3/2020 | 18/3/2020 | 16/3/2020 | -2 |
| Puerto Rico | 28/3/2020 | 29/3/2020 | No Lockdown |
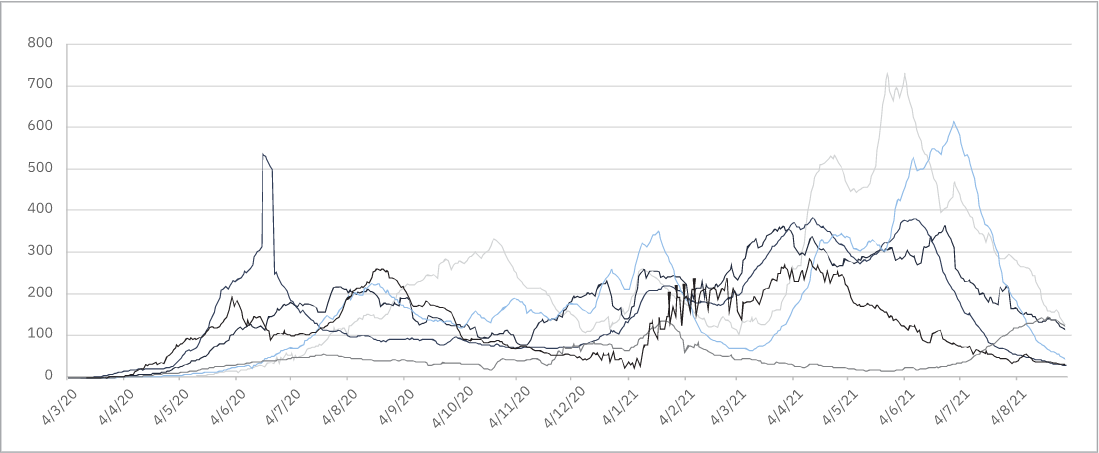
The evolution of the pandemic in major Latin American countries is demonstrated in the graphs that follow, presenting Cases per 1M pop and Deaths per 1M Pop. We note that Chile faced an outstanding peak in May-June 2020, while Argentina a considerable peak in September-October 2020 and an even worse one in April-May-June 2021 and Colombia had its worst peak in June-July 2021.
Cases per 1M - MA 7 Days
Deaths per 1M - MA 7 Days
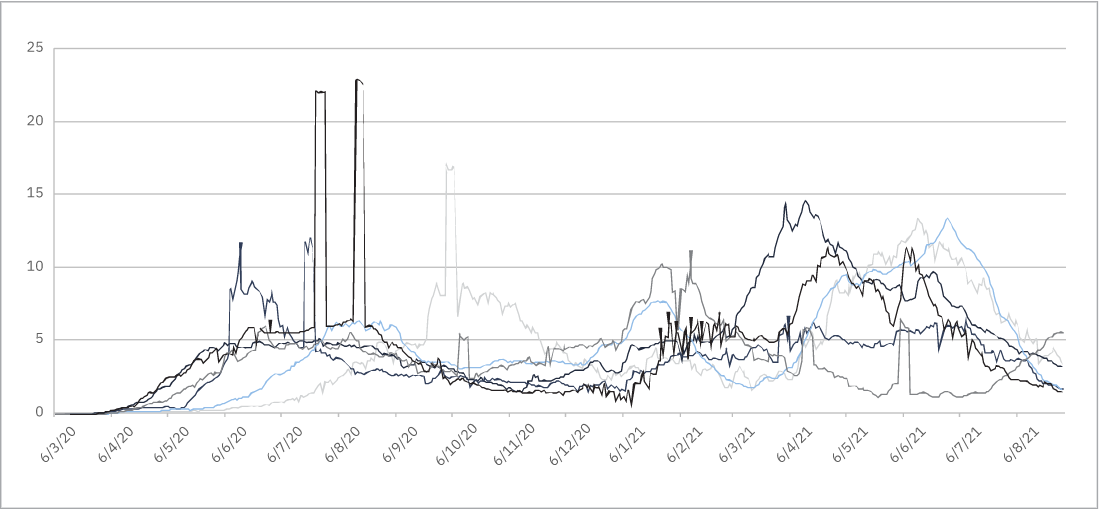
From June 2020 where for that region of the world winter starts, we can see a gradual increase of cases and deaths with some countries doing a lot worse than others. This effect is reversed around November’20 – January ’21 due to summer conditions, while in early autumn the pandemic picks up once more.
Mobility per Month by Country
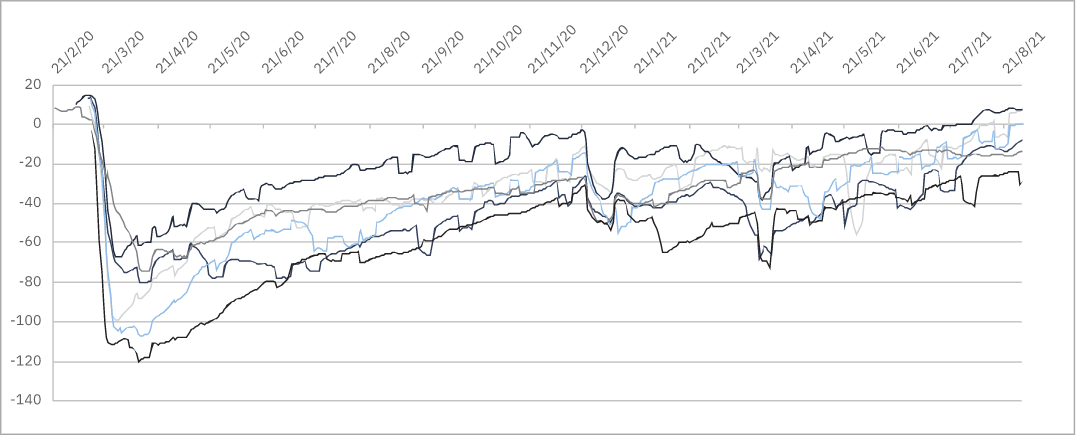
The above mobility graph demonstrates the reduction of population mobility up the middle of May 2020, a result of the early imposed lockdown policies, while after that mobility systematically increases, with minor decrease in some countries (e.g. Peru, Chile) between December’20 and March ’21.
Total Cases per 1M vs Total Deaths per 1M (Feb ‘20-Aug ‘21)
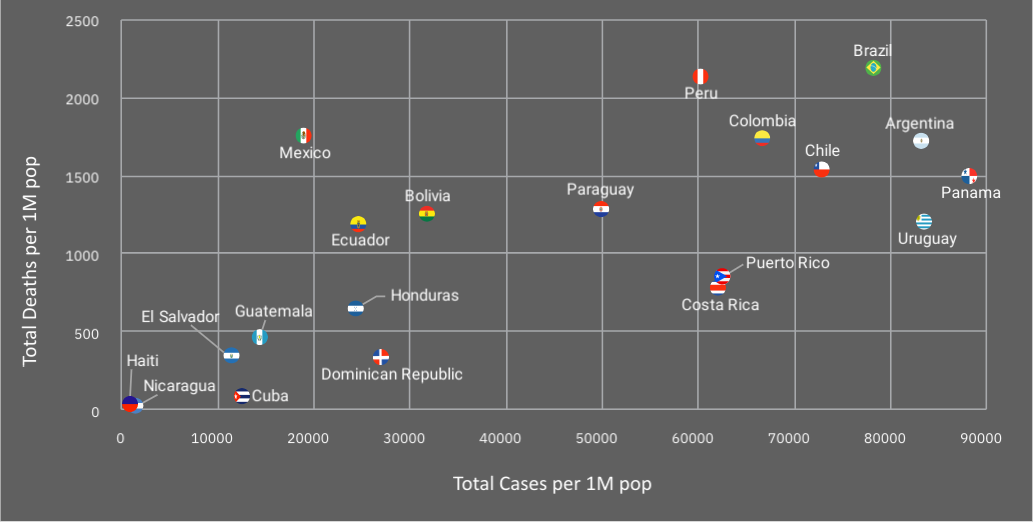
The previous scatterplot correlating Cases per 1M with Deaths per 1M by country, groups the Latin American countries in interesting clusters.
- Countries that are hit strongly (high number of cases and deaths), like Colombia Argentina Brazil etc.
- Countries that are hit mildly or not at all (low number of cases and deaths), like Guatemala, Uruguay, Paraguay and Cuba
- Countries with exceptionally high number of deaths with respect to their number of diagnosed cases (Mexico, Bolivia etc.)
- Countries with exceptionally low number of deaths with respect to their number of diagnosed cases (Costa Rica, Puerto Rico)
Excess Mortality
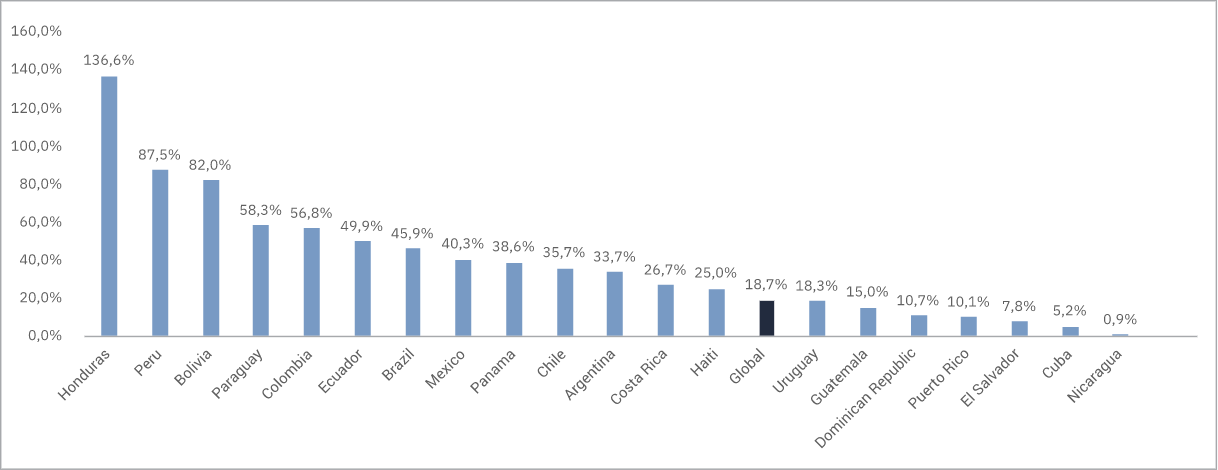
Another indicator demonstrating the severity of COVID-19 pandemic in Latin America is the above histogram where we can see that the mortality due to COVID-19 (Excess Mortality) is much higher than the global figure.
% Vaccinated - Dose
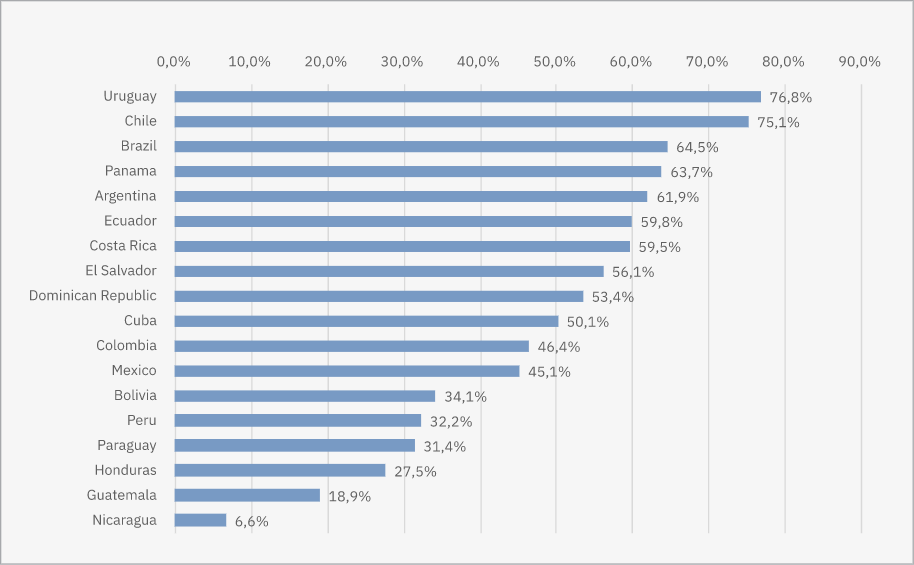
Most of the Latin America Countries have been vaccinated with at least one dose, less than 70% of their population, except for Chile and Uruguay, where over 70% of the population is vaccinated with at least one dose. Half of the Latin American countries are vaccinated less than 50%. Despite Chile’s high percent of vaccination, they suffered an intense third wave. Possibly this was the result of early relaxation of preventive restrictions, as well as a high percent of only first dose of vaccination, which has been proved less effective.