THE EFFECT OF VACCINATIONS
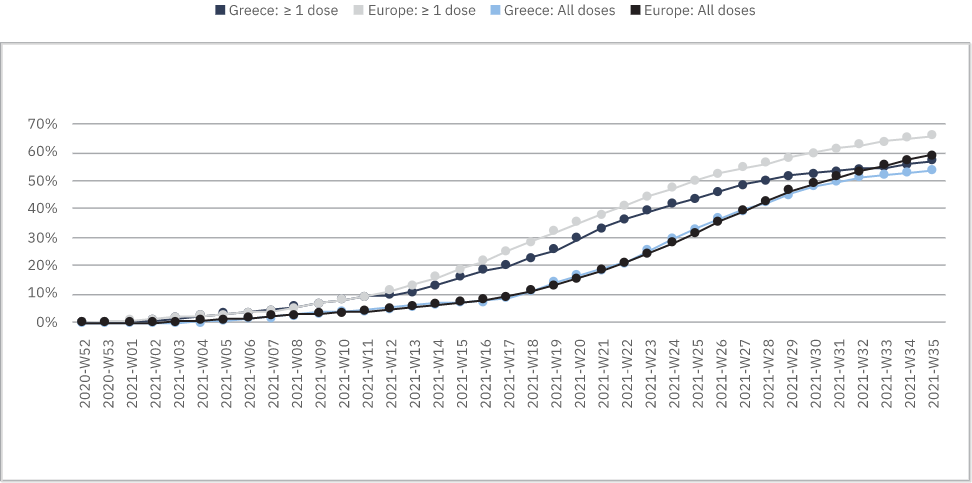
Greece adopted a complete vaccination policy for its citizens. That is all necessary vaccination doses were planned in advanced for every candidate wishing to be vaccinated. Other European countries planned to vaccinate as many as possible citizens with at least the first dose. The results of the alternative approaches are presented in the following graph, where we can see that while Greece is below the European rate by 9%, concerning the citizens vaccinated by minimum 1 dose (57%) and by 5% concerning the fully vaccinated population (54%).
Greece vs Europe Vaccinations
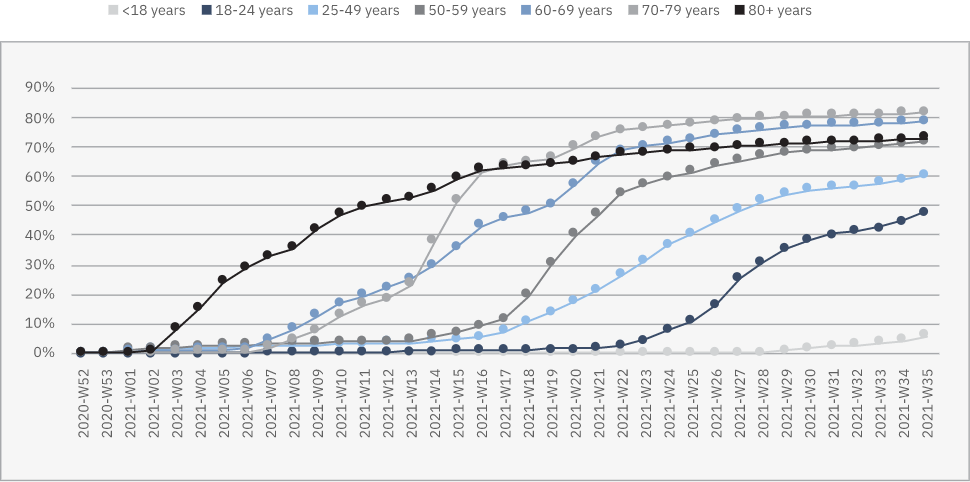
The vaccination policy is dependent on the citizens’ age, prioritizing older people to minimize the risk of infection, but it is also influenced by the citizens’ will to be vaccinated. The following graph demonstrates the evolution of vaccination by age group. The flattening of the curves during the last weeks of the vaccination period indicates citizens’ reluctance to be vaccinated.
At least 1 Vaccine Dose Uptake
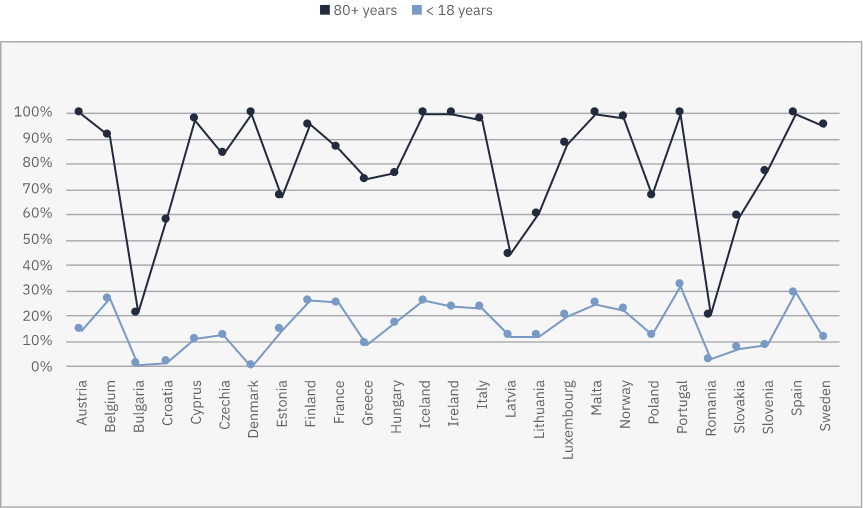
Greece is below EU average in all age groups and most noticeably in 80+ population by 14%.
At least 1 Vaccine Dose Uptake
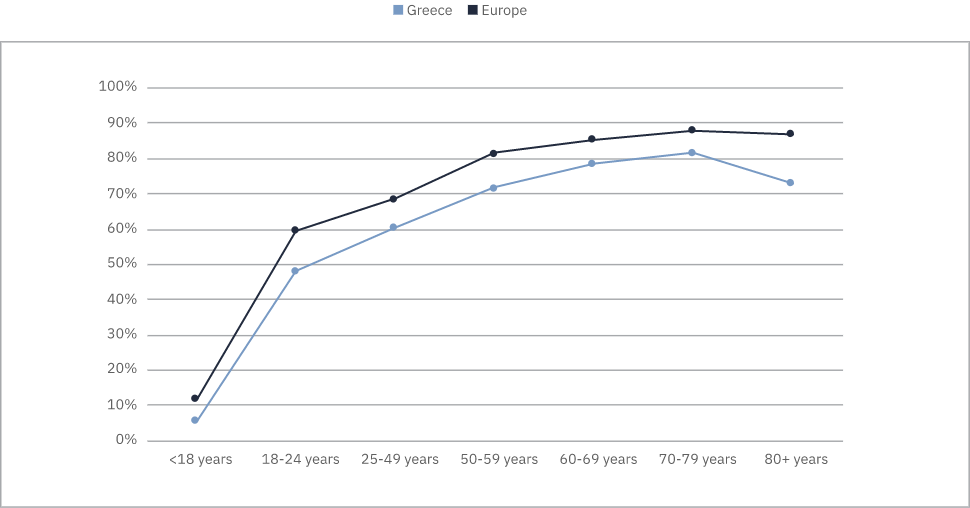
The Balkans, including Greece show a hesitation in vaccinations in both junior and senior age groups, compared to the rest Europe, attributed to social/religious structures.
European Vaccinations
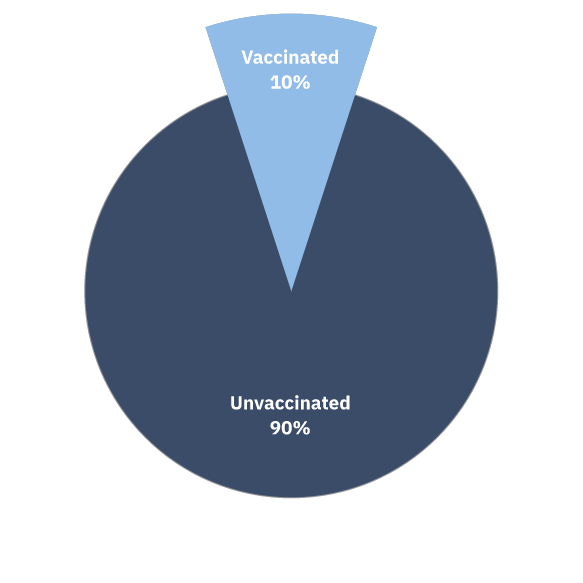
However, the positive effect of vaccinations can be clearly seen on the pie chart below, demonstrating that 9 out of 10 ICU Patients had not been vaccinated.
ICU Patients
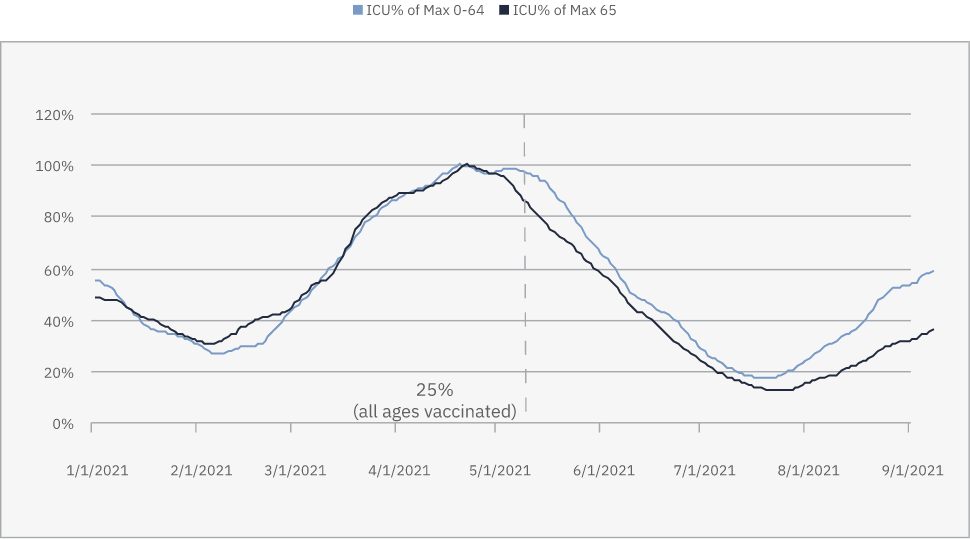
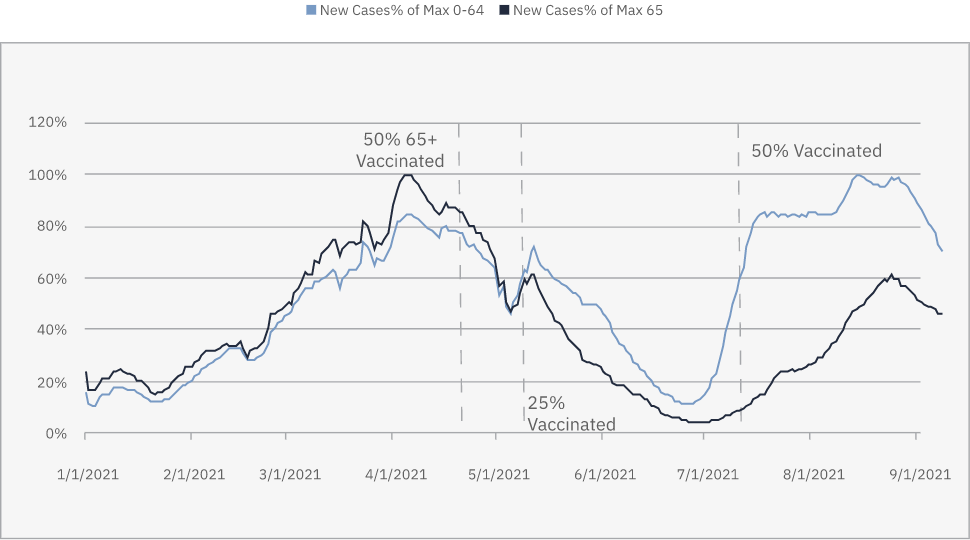
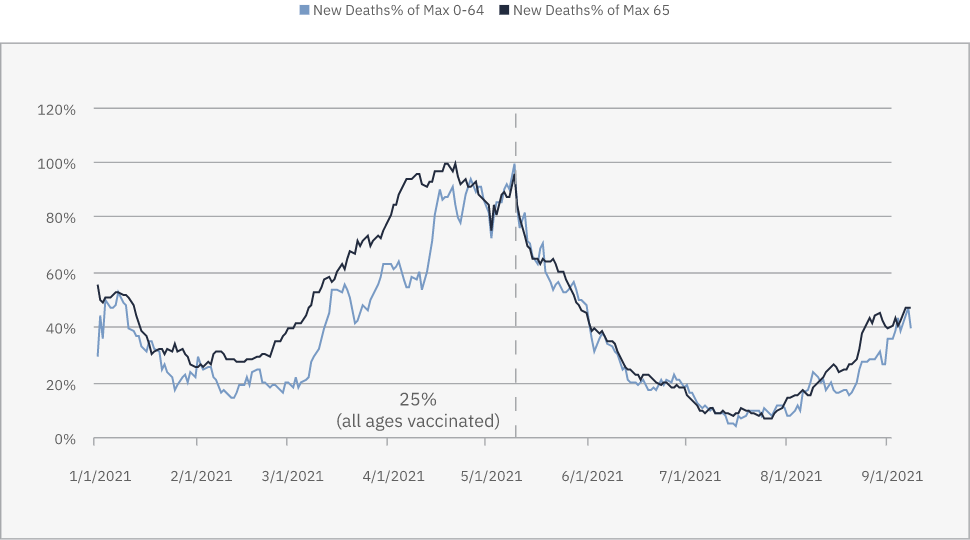
In the following three graphs, the vaccination effect on the pandemic is demonstrated taking into account two major age groups (0-64 vs 65+) and their vaccinated percentage. In the cases graph we can see clearly that the older group, once reaching 50% vaccination produces smaller numbers of cases than the younger group. This difference increases further, once the total population reaches 25% vaccination. Similarly, death rates of both age groups coincide, once 25% of the total population is vaccinated and ICU beds occupation is lower for the older group.
Cases as % of all Waves Peak
Deaths as % of all Waves Peak
ICU as % of all Waves Peak