MEASURES & MOBILITY
The pandemic evolution in Greece can be further analyzed and explained, examining government preventive policies and their effect on citizens behavior and compliance.
The graphs below demonstrate how the government preventive measures influence the population mobility, which consequently affected the virus spread through time.
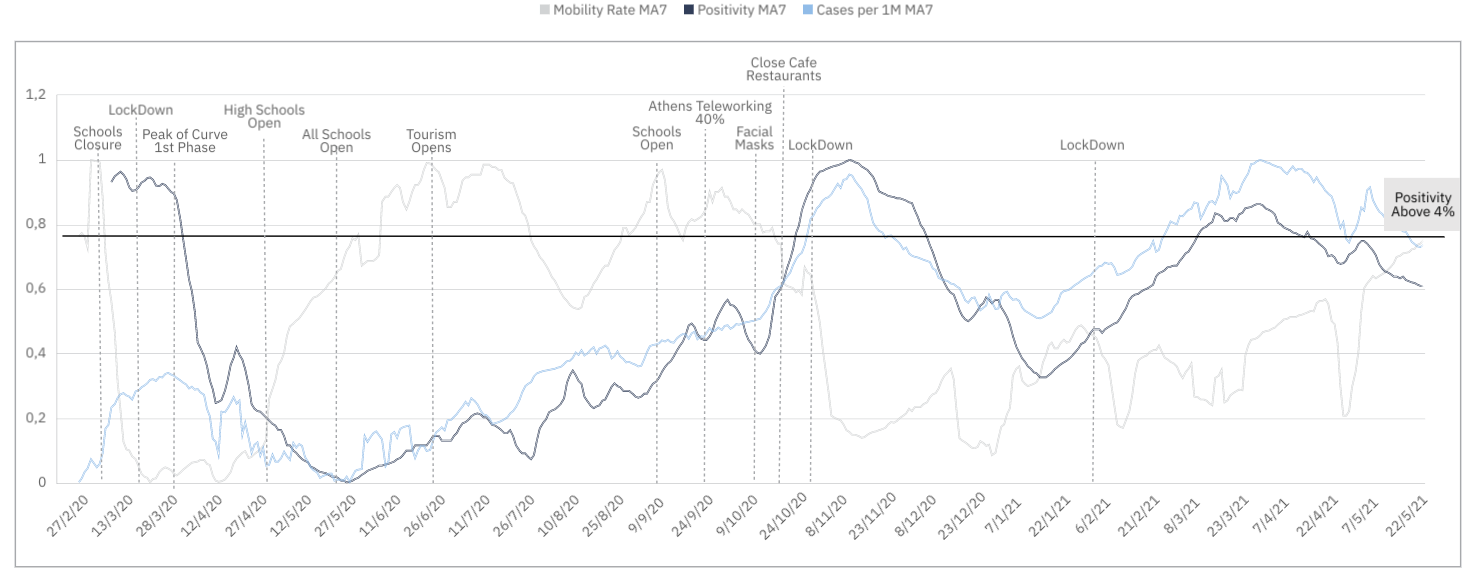
Mobility MA 7 Days - Positivity MA 7 Days - Cases MA 7 Days
Transportation MA 7 Days - Workplaces MA 7 Days - Cases 1M MA 7 Days

Early imposement of drastic measures, such as schools closure and general lockdown, seem to be the success factors during the first wave of the pandemic. During this period (March, April 2020), the population mobility was reduced by ~85%, restraining the spread of the virus. Transportation and Workplaces Mobility decreased together until the re-opening of the economy in May, when this pattern started to change.
During the summer months, with the additional help of the high temperatures, the pandemic was also well-handled despite the fact that we note increased mobility in all means of transport (trains, ships etc.) including incoming foreign tourists. A low peak in Workplaces mobility is noted in August due to the majority of holiday leaves.
During the autumn the extra measure of wearing protective masks everywhere was imposed as the second wave of the pandemic was in progress. But mobility was only half reduced compared to the first lockdown, as a second strict lockdown would have been disastrous for the economy.
Despite the noticed reduced mobility from November ’20 until April ’21, resulting from the 2nd (November ’20) and the 3rd lockdown (February ’21), the effect on the spread of the virus is not as successful as the one during the first lockdown (March ’20).
Domestic infection, as well as the more contagious British mutation, possibly explain this phenomenon.
Cases per 1M - Positivity MA 7 - Tests per 1M
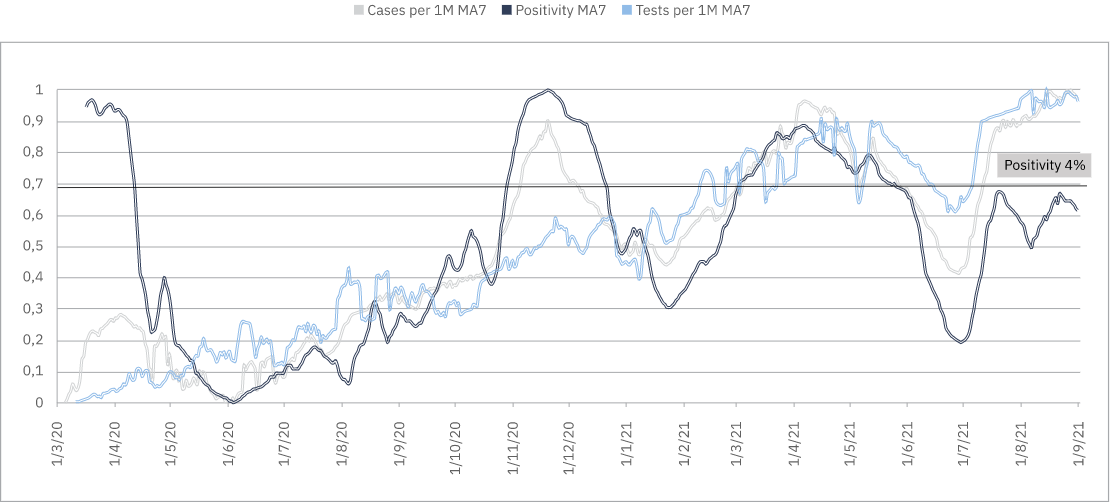
From the end of the summer (September 2020) the number of tests performed were substantially increased for the local population, resulting to higher values of positivity as the virus spread started to increase, especially at the period of 2nd and 3rd Wave. This policy greatly facilitated early detection of the pandemic trend, depicted by the above noted pattern of the three entities (tests, cases, positivity), which tend to converge as the virus outbreaks. Summer ’21 was greatly affected by vaccination, testing and relaxed restriction policies.
Milestones of the Greek pandemic
| Milestone | Date |
|---|---|
| Date of First Case | 27/2/2020 |
| Closing Schools | 11/3/2020 |
| Date of 100th Case | 13/3/2020 |
| 1st Lockdown | 23/3/2020 |
| Peak of Curve 1st Wave | 4/4/2020 |
| Opening High Schools | 11/5/2020 |
| Opening Primary Schools | 1/6/2020 |
| Open Tourism | 1/7/2020 |
| Opening Schools | 14/9/2020 |
| Teleworking - 40% | 26/9/2020 |
| Face Masks - Obligatory | 22/10/2020 |
| Closing Restaurants - Café | 2/11/2020 |
| 2nd Lockdown | 7/11/2020 |
| 3rd Lockdown | 12/2/2021 |
In the following graph it is impressive to see the negative correlation between government restrictions and the spread intensity as depicted by the Rt index.
Government Stringency Index MA 7 - Rt
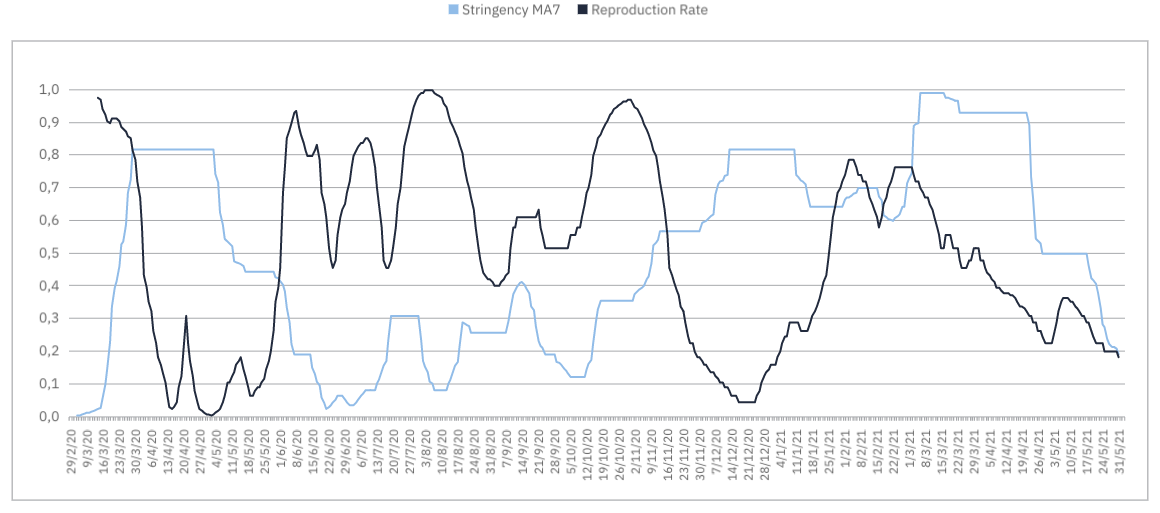
The Rt curve shows the speed of the spread at specific time intervals and how it is influenced by measures’ stringency. It is apparent that these two metrics are strongly negatively correlated, that is as the one increases the other decreases, except from the period of Feb’21-Mar’21, when despite Government Measures the Rt increased, mostly because of domestic infection and the more contagious British mutation.